Renkforce RF100 settings

These Basic Cura settings mostly work best for my 3D prints on RF100 using original Cura software (15.04.6))

Quality:

  • Layer Height: 0.08 (mm)
  • Shell Thickness: 0.8 (mm)
  • Enable retraction: Yes

Fill:

  • Bottom/Top thickness: 0.7 (mm)
  • Fill density: 25 (%)

Speed and temperature:

  • Print speed: 40 (mm/s)
  • Printing temperature: 210 (C) (for PLA)

Support:

  • Support type: Touching Buildplate
  • Platform adhesion type: Brim (important: prevents most warping issues)

Filament:

  • Diameter: 1.8 (mm) (important: depends on actual filament size offcourse)
  • Flow: 100 (%)

Machine:

  • Nozzle size: 0.4 (mm)

Reset RDP server grace period (WS 2012 R2)

You might want to reset the RDP server grace period when you are running a test-server, or when you have a license key but re-installed your server and forgot to deactivate the licence before the re-install. Because it then is still activated, the Microsoft activation servers see this as a new activation on an already activated key and you also won’t be able to do the activation manually but need Microsoft support to reset the activation which is virtually impossible when you have a “simple” SMB licence.

See also this site for Microsoft support for volume licensing.

See also this article or this one.

High level view of the required steps:

  1. Gain administrative access to the server
  2. Check the current Grace period using TLSBLN.exe
  3. Use registry editor and browse to the Graceperiod key for RDP licensing.
  4. Obtain required privileges for removing the key.
  5. Remove the key.
  6. Restart the RDP server service (or reboot the Server)

Once the Grace period has expired you won’t be able to login to the server using a “regular” RDP session. You should still be able to gain access via admin mode, e.g. using

mstsc /admin

You might have seen a message like “” popping up. When you are curious about the latest status just type the command TLSBLN.exe at a command prompt, or directly in the windows search box and hit enter. This will show the Terminal Services License Server Balloon stating how many days are left in the grace period.

If you are near the end of this period you might want to renew the grace period. This is possible by removing the timebomb key that is in the Windows registry at \HKEY_LOCAL_MACHINE\SYSTEM\CurrentControlSet\Control\Terminal Server\ RCM\GracePeriod\L$RTMTIMEBOMB_*

Use the registry editor to browse to this key, then first obtain the required privileges by making the administrator user owner of the Graceperiod key and the giving it required permissions. Then remove the L$RTMTIMEBOMB_* key.

After removing the key either reboot the server (safest) or restart the “Remote Desktop Services” service (this will also require restarting the “Remote Desktop Services UserMode Port Redirector” service). Note that if an issue occurs during restarting the RDS service and you are not on-site, you have the risk of locking out yourself. Make sure you have an alternative way of logging on to the server (or safely restarting it).

Before rebooting the server, you might want to check if any users are logged in on the server via the RDP server, the simplest way to do this is to use task manager – Users, where you can see which users are logged on and have active connections.

After that a new L$RTMTIMEBOMB_* registry key is created in the GracePeriod key and a new 120 day grace period is started.

Magnetometer info

A random collection of various articles about Magnetometer (and other MEMS) sensors. Please let me know any other interesting articles with recent updates on this subject.

Datasheets

  • IIS2MDC (from ST) ca. € 1.31 / 100 (similar to LIS2MDL but temp. compensated?)
  • LIS3MDL (from ST) ca. €  0.90 / 100
  • LIS2MDL (from ST) ca. € 0.984 / 100
  • LSM9DS1 (9DOF from ST) ca. €  3.77 / 100
    (LSM9DS0 seemed to be more accurate, but EOL)
  • MPU-9250 (9DOF from Invensys) ca. € 4.90 / 100

Products

Drivers:

Random notes from reading blogs and articles (FWIW):

MPU9250 is good value for money
AK8963A is embedded in MPU9250
MPU6500 (accel/gyro in the MPU9250)
LSM9DS1 has the LIS3MDL embedded
LSM9DS1 has no advantage over MPU9250

Other:

AK9912
HMC5883 very good (low noise) but EOL
many Chinese shops offer QMC5883 as a replacement, but it is mostly inferior to HMC5883
HMC5983 was the newer Honeywell offering (not available anymore)
LIS2MDL and LIS3MDL good Magnetometer from ST
LIS3MDL is replacement for LSM303C?
MAX21100 (no Magneto)
Bosch BMF055 not as good as MPU9250

Build Raspberry Pi Soundmonitor

PlayStation_Eye

This article describes how to build a simple soundmeter using a Raspberry Pi and a ‘simple’ microphone. In this case I used a somewhat more advanced microphone: The PS3 Eye Camera because it currently (2018) is a great 4 microphone array that is still readily available and can be bought on a budget  (also you get a camera with it for free :-).

I’m using the Python soundmeter package for this. Simply install it according to the instructions mentioned on the mentioned pypi page:

sudo apt-get install portaudio19-dev python-dev alsa-utils
pip install soundmeter pyaudio
sudo apt-get install ffmpeg

Change  2 lines in /usr/share/alsa/alsa.conf

defaults.ctl.card 0  ==> defaults.ctl.card 1
defaults.pcm.card 0  ==> defaults.pcm.card 1

This way the new microphone device becomes the default device on the system. This will cause alsa tools to use the new USB microphone as the default device.

Depending on the way how you installed pip you might need to add the pip bin path to your PATH variable, e.g by adding the following line to your ~/.profile file:

PATH=$PATH:~/.local/bin

Now start the soundmeter:

soundmeter

You should see numbers on the screen that are refreshed (on the same line) every second like this:

       131

These numbers represent the sound level captured by the microphone. Note that these numbers are not calibrated in any way, but it should be clear that the numbers actually relate to the sound level.

Because we would like to be able to correlate the soundlevel to the time it occurred we want to add a timestamp to the measurement, this can be done by changing a line in the file meter.py in the routine meter  like below:

def meter(self, rms):
    if not self._graceful:
        sys.stdout.write('\r%11d %10d ' % (time.time(),rms)) # <== This line was adjusted to include a timestamp

This way each sample is preceded by a timestamp in epoch time and you should see lines like below when you start soundmeter again:

 1520694811 123

Off course you should take care that the time on your Raspberry is synced to the actual time (e.g. using ntp or a GPS). This way we can store the data and later correlate it to certain point in time.

By default the interval in which measurements are done is 0.5 sec. This can be increased to another interval by using the –segment option, e.g. for a 2 second interval:

soundmeter --segment 2

Recording Sound

Besides monitoring the sound level you might also be interested to record some sounds using this great microphone. Because raw audio files tend to grow very quickly when using high sampling rates and 16 bits you might want to compress the data (e.g. suing MP3). This can be done with the ALSA arecord and the lame MP3 frontend:

sudo apt-get install lame

And record using:

arecord -f S16_LE -c2 -r8000 -t raw -D plughw:1,0 -d 10 | lame -r -s 8 -b 64 - sound-10secs.mp3


My First Camera Drone

Over the past years I have been following the developments with respect to so called “drones” with some interest. The first mass market player being the Parrot AR drone. Especially the combination of affordable drone with a camera that seemed easy to fly appealed to me. However looking at actual footage it became clear to me that it was a nice toy, but seemed not suitable for creating quality video.

Over the past few years this changed notably. Especially the DIJ Phantom seemed to bring quality video at an affordable price-point. I atarted investigating the drones that seem to be able to deliver quality video for an affordable price at this moment (summer 2015)

In this article I want to share my experiences selecting a “drone” that I want to use for creating nice video footage for personal use (e.g. holiday footage, outdoor activities, sports etc.). I will gradually extend this article during my quest for the “best” camera drone that fits my (not yet exactly defined) budget and requirements. If you are into this subject yourself you will probably get bored by this article quickly, when you find yourself in the same situation it might be of interest to you.

My First Shortlist

I started creating a shortlist so I don’t have to consider each drone in detail. At first I started out with only a rough idea about the requirements being: able so shoot “quality video footage” for an “affordable price” (e.g. < € 1500,) this for now resulted in the following list.

  • DIY Phantom 2 with add-on camera (e.g. GoPro)
  • DIY Phantom 2 Vision+
  • DIY Phantom 3
  • Yuneec Q500 Typhoon
  • 3DR Solo (not yet available in Europe?)

Detailing requirements

Off course when spending a serious amount of money the above mentioned requirements are not really suitable, so when diving further into the subject matter and comparing specifications and actual footage shot by the drones on the shortlist I became more aware of what I really needed.

Get a Gimbal

When comparing footage it became clear to me that to shoot any serious video using a drone you need a gimbal. The video that made me realize this can be found here.

Other requirements

  • GPS support
  • Video Link / FPV
  • (Affordable) Spare parts
  • Support by seller and supplier

First experiences with the Lua Nodemcu ESP8266 Based WIFI Network Development Board

Note: this article is still under construction! There is a new version (v2) of this board with pin-spacing that is more convenient for use with breadboards (also available from other suppliers).

For some time now I observed a buildup of the buzz around the ESP8266 IoT devices. I only recently started with exploring microprocessors (uP’s) in more depth (Arduino family, TI TM4C123G and MSP430 Launchpads). I first saw the ESP8266 mentioned as a Wifi add-on device to these uP’s, however last months more and more standalone applications for these great little devices popped up in various articles. So I decided to buy a few and start experimenting with them. So this article is written from a beginners perspective.

Because these devices are so cheap (less then $3 on sites like eBay) I decided to buy a few of them so I could build multiple devices and applications. Also because I like to start the easy way I decided to buy a few development boards also. These boards are suited for use on a breadboard and have more GPIO pin breakouts than the ‘standard’ ESP8266 devices.

While investigating the possible options for the different ESP8266 based boards I wrote an article explaining the different available form factors for these boards (still to be published)

Besides some standard ESP-01 form factor boards I also ordered an ESP-07, and ESP-12 with and I/O adapter plate, and 2 development boards:

  • Lua Nodemcu ESP8266 Based WIFI Network Development Board ($ 8,95 from eBay)
  • ESP8266 Wireless Wifi Module Develop Board 8266 SDK Development Chip with the cable ($15 from aliexpress)

NodeMCU devboard

NodeMCU devboard

I ordered with different sellers on eBay and AliExpress. I was used to waiting for several weeks when ordering from Chinese web-shops, however this time the goods from 2 eBay sellers arrived within 8 days!

As the development boards and boards with I/O adapter plate have pin’s spaced at 0.1 inch (2.54 mm) I expected them to be suitable for breadboard experiments. Unfortunately the ESP-07 and ESP-12 based ones did not come pre-soldered, so I had to solder the ESP-8266 and the headers onto the I/O adapter plates. Fortunately the Lua Nodemcu development board did come with the headers soldered on so I expected I could start immediately experimenting.

However it turned out that the spacing of the rows of the boards was at 1 inch, so the width of the boards would cover all available holes in the terminal strips of the breadboard. So I started off using jump wires to connect the boards to the breadboard and other components directly.

The development boards have a micro USB connection that can be used for direct communication with the device from a computer, so there is no need to have a USB-to-TTL dongle available separately. For a first prototype I decided to try to build a fairly standard DS18B20 based temperature sensor IoT device first.

The first hurdle when starting with such a board is getting a serial connection to the board. When I plugged in the board I saw in device manager the dreaded yellow exclamation mark indicating no suitable driver was found. It turns out the board uses a CH340G USB/UART converter chip. I downloaded the driver from arduined.

Schermafdruk 2015-04-26 21.32.10Once the driver is installed you can obtain the assigned serial COM port number via the device manager (available in the control panel). It should be possible to connect via this COM port to the LUA interpreter running on the ESP8266 using your favorite terminal emulator program. Most boards are configured for 9600 baud (1 startbit, 8 data bits, no parity). If you don’t get any prompt it might be that there is no firmware on the devboard, or the firmware uses a different baud rate. Just try some settings untill you get a response.

Schermafdruk 2015-04-26 21.41.39An easy way to communicate with the LUA interpreter on the ESP8266 is by using the ESP8266 LuaLoader. It allows you to perform simple tasks (like setting the SSID and password for your wireless router so it can connect to you network) via a GUI. You can also read out or set the status of its GPIO ports, obtain information like the IP address or the chipID, or upload files. However after some more experimenting I finally settled on ESPlorer which has a more contemporary user interface and has syntax highlighting on LUA code.


To be continued… (Sorry article is not yet ready)

Software used

The following software was used in realizing the wireless temperature sensor:

  • NodeMCU Flasher – for uploading the latest NodeMCU firmware to the ESP8266 devboard.
  • ESP8266 LuaLoader – for easy interaction with the NodeMCU commandline.

References

Determining the right frequency for ec3k

It turned out that to be very critical to tune your rtlsdr tuner to the right frequency when trying to receive data from the Conrad Enery count 3000 (aka Velleman NETBSEM4, aka LaCrosse Techology Remote Cost Control Monitor – RS3620). That’s why I investigated this a little further. The results can be found below.

Using ec3k with Raspberry Pi

The gnuradio based ec3k software allows you to receive data from the Voltcraft Energy Count 3000 sold by Conrad. This device is also sold under different brand names such as “Velleman NETBSEM4” and “La Crosse Techology Remote Cost Control Monitor – RS3620”.

volctraft-ec3000velleman-netbsem4

These sets contain plugs and a little display device that looks a little like a remote control. The display device can be used to receive and display the data from the plugs. Each plug sends out a data packet each 5 seconds, the data that is sent contains the following information:

  • The unique ID for the plug (a 4 character hex number)
  • The current power usage (in Watts)
  • The maximum usage of the device (in Watts) since the start of the measurements
  • The total energy usage (in Wh) since start of the measurements
  • The time that the device was ‘on’
  • The total time since the start of the measurements

emoncmsReceiving this information using a computer allows you to plot nice graphs of your energy usage per device / plug, giving great insight in energy usage of different devices in your household.

Using the ec3k software on a regular x86 or x64 based Linux device is quite straightforward, however using it on an ARM processor based Linux device like the Raspberry Pi turned out to have some quirks. The main thing is that the Gnuradio software is not (yet) available as a package in the repositories of the Linux variants for the Raspberry and that there is an issue when compiling the Gnuradio sources as-is. That’s why I wrote this little blog to help out anyone who wants to use this setup.

As all software mentioned in this blog is still evolving always first have a look at the requirements as mentioned for ec3k at the github page or the pypi page.

The basic steps are

  • Download and install a Raspberry Pi image with Gnuradio pre-installed
  • Download and install the ec3k software
  • Fix the Gnuradio installation by downloading Gnuradio and compiling a small part of it
  • Start the ec3k software for testing
  • Adjust the ec3k_recv script
  • Write a script to send the data received to your favorite dashboard software

Please note that I am doing nothing new or special here, I’m just using software that others have kindly made available to the public.

Download a Raspberry Pi image with Gnuradio

Gareth Hayes created a Raspberry Pi image for Software Defined Radio which includes Gnuradio. It can be downloaded using the Torrent mentioned in his article. It’s a 3.75 Gb download so it can take some time depending on your Internet speed.

Install the Raspberry Pi image on an SD-card

After you have downloaded the Raspberry Pi image, you can install it on an SD-card using your favorite software, I used Win32 Disk Imager for this. Please use an SD-card of at least 8Gb so you will have some spare room for software and data. Put the SD-card in your PC, just start Win32 Disk Imager, choose the downloaded file as “Image File”, and the drive for your SD-card as “Device”. Then press “Write”.

If you don’t have a spare SD-card and you want to preserve the content of your current Raspberry Pi SD-card, then choose a backup location in “Image File” and press “Read” first. This will save your current SD-card image so you can restore it later.

Once the image is on the SD-card, boot your Pi with it. It is easiest if you connect the Ethernet port of your Raspberry to your home network (assuming a DHCP server is running locally). This way the Pi will automatically obtain an IP address. (you can determine it’s IP address by having a look at the DHCP administration of your local router (or other DHCP server), it will register with the name “raspberry”). You can login to the Pi via SSH using the username ‘pi’ and password ‘raspberry’.

Note that the installed image file does not have any free space left so we can’t add anything to it. We first have to extend the partition to the full size of the SD-card. You can do this using standard tools like fdisk and  resize2fs, Basically the steps are: throw away the Linux partition and create it again with the same “first sector numer”, but now let fdisk fill in the “last sector number” which defaults to the end of the disk / SD-card. Then use resize2fs to extend the filesystem within the larger partition. This goes like:

pi@raspberrypi% sudo fdisk /dev/mmcblk0

Command (m for help): p

Disk /dev/mmcblk0: 7948 MB, 7948206080 bytes
4 heads, 16 sectors/track, 242560 cylinders, total 15523840 sectors
Units = sectors of 1 * 512 = 512 bytes
Sector size (logical/physical): 512 bytes / 512 bytes
I/O size (minimum/optimal): 512 bytes / 512 bytes
Disk identifier: 0x000b5098

 Device Boot Start End Blocks Id System
/dev/mmcblk0p1 8192 122879 57344 c W95 FAT32 (LBA)
/dev/mmcblk0p2 122880 7872511 3874816 83 Linux

Command (m for help): d
Partition number (1-4): 2

Command (m for help): p

Disk /dev/mmcblk0: 7948 MB, 7948206080 bytes
4 heads, 16 sectors/track, 242560 cylinders, total 15523840 sectors
Units = sectors of 1 * 512 = 512 bytes
Sector size (logical/physical): 512 bytes / 512 bytes
I/O size (minimum/optimal): 512 bytes / 512 bytes
Disk identifier: 0x000b5098

 Device Boot Start End Blocks Id System
/dev/mmcblk0p1 8192 122879 57344 c W95 FAT32 (LBA)

Command (m for help): n
Partition type:
 p primary (1 primary, 0 extended, 3 free)
 e extended
Select (default p): p
Partition number (1-4, default 2): 2
First sector (2048-15523839, default 2048): 122880
Last sector, +sectors or +size{K,M,G} (122880-15523839, default 15523839): 
Using default value 15523839

Command (m for help): p

Disk /dev/mmcblk0: 7948 MB, 7948206080 bytes
4 heads, 16 sectors/track, 242560 cylinders, total 15523840 sectors
Units = sectors of 1 * 512 = 512 bytes
Sector size (logical/physical): 512 bytes / 512 bytes
I/O size (minimum/optimal): 512 bytes / 512 bytes
Disk identifier: 0x000b5098

 Device Boot Start End Blocks Id System
/dev/mmcblk0p1 8192 122879 57344 c W95 FAT32 (LBA)
/dev/mmcblk0p2 122880 15523839 7700480 83 Linux

Command (m for help): w
The partition table has been altered!

Calling ioctl() to re-read partition table.

WARNING: Re-reading the partition table failed with error 16: Device or resource busy.
The kernel still uses the old table. The new table will be used at
the next reboot or after you run partprobe(8) or kpartx(8)
Syncing disks.

pi@raspberrypi% sudo shutdown -r 0
Broadcast message from root@raspberrypi (pts/0) (Tue Oct 28 09:43:20 2014): 
 The system is going down for reboot NOW!

Now login again and extend the filesystem

pi@raspberrypi% sudo resize2fs /dev/mmcblk0p2
resize2fs 1.42.5 (29-Jul-2012)
Filesystem at /dev/mmcblk0p2 is mounted on /; on-line resizing required
old_desc_blocks = 1, new_desc_blocks = 1
The filesystem on /dev/mmcblk0p2 is now 1925120 blocks long.

Now we have a raspbian image with Gnuradio and some free space on it.

Download and install the ec3k software

Once logged in to the Pi and assuming you have Internet access you can download the ec3k software, unpack and install it. Please first have a look at https://pypi.python.org/packages/source/e/ec3k and verify that you are downloading the most recent version (which was ec3k-1.1.1 at the time of writing, note that the original  ec3k-1.1.0 does not work together with Gnuradio 3.5.7).

wget https://pypi.python.org/packages/source/e/ec3k/ec3k-1.1.1.tar.gz
tar xvzf ec3k-1.1.1.tar.gz
cd ec3k-1.1.1/
sudo python setup.py install
python setup.py test # this is optional

If everything was OK you should now be able to run the ec3k_recv script, so let’s try:

pi@raspberrypi ~ $ ec3k_recv
linux; GNU C++ version 4.6.3; Boost_104900; UHD_003.004.002-0-unknown

gr-osmosdr v0.1.3-4-g42c66fdd (0.1.4git) gnuradio 3.7.5git-0-g2bb2b314
built-in source types: file fcd rtl rtl_tcp uhd hackrf rfspace
Using device #0 Generic RTL2832U OEM
Using 16 buffers of size 262144.
usb_open error -3
Please fix the device permissions, e.g. by installing the udev rules file rtl-sdr.rules

FATAL: Failed to open rtlsdr device.

Trying to fill up 1 missing channel(s) with null source(s).
This is being done to prevent the application from crashing
due to gnuradio bug #528.

Using Volk machine: generic
VOLK: Error allocating memory (posix_memalign: 22)
Segmentation fault

So not everything seems to be OK. There are still 2 issues to be solved:

  • Installing udev rules for rtl-sdr
  • Fix the Gnuradio VOLK memory allocation issue

Fixing the issues

For installing the udev rules, please follow these instructions on instructables.com. Please use the ID’s as found by lsusb for your rtl-sdr device. Use the command

sudo /etc/init.d/udev restart

to restart udev.

Fixing the Gnuradio VOLK memory allocation issue takes a little bit more time: First download and unpack the Gnuradio source:

wget http://gnuradio.org/releases/gnuradio/gnuradio-3.7.5.tar.gz
tar xvzf http://gnuradio.org/releases/gnuradio/gnuradio-3.7.5.tar.gz

We have to apply the fix as mentioned here.

So obtain the patch, and apply it:

wget http://gnuradio.org/redmine/attachments/download/821/0001-volk-Fix-volk_malloc-when-alignment-is-1.patch
patch -p1 < *volk*.patch

Now build the volk part of Gnuradio and install it:

mkdir build
cd build
cmake -DENABLE_DEFAULT=Off -DENABLE_VOLK=True -Dhave_mfpu_neon=0 ..
make
sudo make install

Use it (and fix another issue…)

Now we should be able to use the ec3k_recv script. I however noticed that the ec3k_recv as installed indeed runs, shows output about Noise levels steadily increasing (with -dB numbers going from about -40 dB up to -16 db in my case (due to auto-gain), however it would never show any valid output.

If you experience the same, don’t despair: It turns out that the default frequency that is being used in the ec3k software (868.402 MHz) doesn’t work for my dongle. At first I fiddled around a little with the frequency and found 868.24 MHz to be working quite decently. However when using another almost identical dongle it again didn’t play well with that adjusted frequency. I got curious and wrote a little script to ‘scan’ several frequencies around 868.3 MHz, I put the results in a stacked bar-graph for my dongles. I found the results quite surprising, I expected to see some kind of “standard distribution”, however the results were quite different:

ec3k_distribution

So it seems like there are 4 regions in the frequency spectrum around 868.3 MHz which are sensitive to receiving the ec3k data packets with gaps in between them where the dongle seems almost deaf to the signals. I’m not yet quite sure what causes this. It might be because of the used modulation (FSK), the way the decoding software is setup, the dongle/tuner/antenna used or any combination of these. Anyone who is more experienced with radio technology, DSP and/or SDR is welcome to comment on this phenomenon.

Anyhow: this clearly shows that setting the right frequency for your dongle is of utmost importance if you want to receive most data packages from these plugs. I will cleanup the code of the scanner script a little and try to have it incorporated in the ec3k software. I’m still having some doubts about the results of the test and finding the best frequency because of the effects of using auto-gain during the measurement.

Another way to find the right frequency is to hook-up your dongle to a Windows system, Install SDR# or another SDR package that can do a waterfall plot (a.k.a scrolling spectrum plot). It seems like the best frequencies are just besides the center frequency for the dongles (where there is no ‘red’ color, this also depends on the settings of SDR#).

sdr-sharp-ec3k

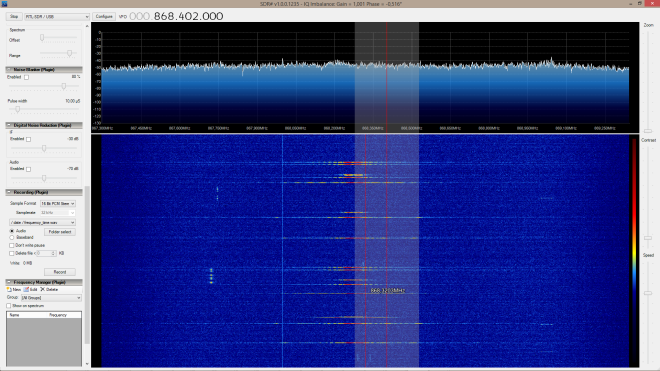
You can fix the frequency in ec3k.py at line 275 (for version 1.1.1, this may be different for a new version of ec3k). If you write your own client program (like ec3k_recv) then it is best you also provide this frequency using an extra ‘freq=868.xxxe6’ parameter in the call to ec3k.EnergyCount3K. This way you can later update the ec3k software without having to modify its source code.

Just have a go at it and you will probably find a frequency that is suitable for your plugs.

Optimize it

Because the Raspberry Pi has a quite modest processor and ec3k uses Guradio in a quite powerful way, cascading several Gnuradio blocks together, CPU usage will be quite high. Even so high you will typically get so called overflows (the dreaded “OOOOO” lines from Gnuradio) which mean that the software can’t keep up with the data that is flowing in.

To alleviate things a little we can use an optimized capture program written in C instead of in Python, This will place a lesser burden on the CPU minimizing overflows. This can be done as follows:

wget https://www.tablix.org/~avian/am433/am433-0.0.5.tar.gz
tar xvzf am433-0.0.5.tar.gz
cd am433-0.0.5/am433/
make
sudo cp capture /usr/local/bin

Now ec3k_recv will use the C program capture instead of the somewhat less efficient capture.py program. You should see less O’s now 🙂

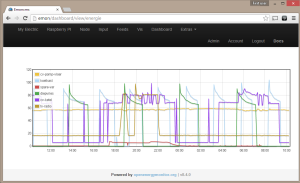
Feed the data to a dashboard

This will be handled in a next edition of this blog.

Relevant Links

Getting data from Voltcraft Energy Count 3000 on your computer

NOTE: this is not a yet a complete howto article, I just mention what can be achieved with this nice gadget and refer to some interesting information about this product.

Conrad sells a nice little gadget: the Voltcraft Energy Count 3000 that enables you to monitor the energy usage of up to 10 individual devices. The package contains 2 “power monitors” and a little remote receiver that enables you to “pair” with individual “power monitors”. You can also buy individual power monitors or a set of 3 extra power monitors. These devices are also sold under the brand name Velleman (type NETBESEM4) and “La Crosse Techology Remote Cost Control Monitor” (type RS3620).

After a power monitor is paired you can receive and display data from it. The data that is shown is:

  • The current power usage (in Watts)
  • The maximum usage of the device (in Watts) since the start of the measurements
  • The total cost since the start of the measurement
  • The cost per month based on the total power usage since the start of the measurements
  • The total energy usage (in Wh) since start of the measurements
  • The time that the device was ‘on’
  • The total time since the start of the measurements
  • The ID for each power monitor so that you can identify which power monitor belongs to what “channel”

For reliably determining the total cost you need to first set a “tariff”.

Besides reading out the data using the little remote receiver you can also use a  RTL-SDR supported radio receiver and the GNU Radio software defined radio framework for this. The following links refer to usefull information:

To use the software you first need to install the gnuradio framework and the gr-osmosdr package

  • TODO
  • sudo apt-get install gr-osmosdr

After all preconditions have been met you can install and test the software:

  • git clone git://github.com/avian2/ec3k.git
  • cd ec3k
  • sudo python setup.py install
  • python setup.py test

Installing gnuradio and gr-osmosdr using the default package installation for your release may result in issues. You may want to build gnuradio from source as described here.

Using MQTT for publishing environmental data

In this article I show how I started using mosquitto on a Raspberry Pi and an Ubuntu VM.

The basics

One of the easiest way to start using MQTT is using a public MQTT broker. I chose to use test.mosquitto.org. A minimal but fun scenario to use MQTT on a debian/Ubuntu based Linux system involves:

  • Install MQTT command line tools:
    sudo apt-get install mosquitto-clients
  • Point your browser at a MQTT consumer widget at mosquitto.org:
    http://test.mosquitto.org/gauge/
  • Publish some data to the temp/random topic at the MQTT broker at mosquitto.org:
    mosquitto_pub -h test.mosquitto.org -t temp/random -m 23.0

And see how the gauge changes to the value you just submitted.

You can also start your own subscriber for the temp/random topic at  test.mosquitto.org:
mosquitto_sub -h test.mosquitto.org -t temp/random
You will see the value that was last sent to the topic, which is probably the value you just sent (but someone else might have sent another value in the mean time which should then also be reflected at the gauge you still have open in your browser). It seems the temp/random topic will always return 11. as the first value, after that you will receive the values you (or someone else) published on the subject. Just publish a few different values using the mosquitto_pub client program and see how both subscribers report the new values.

This shows the basic workings of a message queuing solution like the MQTT based Mosquitto implementation. The basic components are:

  • One or more publishers publishing data ‘topics’ and sending them to a broker.
  • One or more subscribers subscribing at the broker for certain events on a topic (like arrival of published data for some topic).
  • The broker receiving data and events for certain topics from publishers and distributing that data to subscribers for that data or events.

In the case above we have a publisher (the mosquitto_pub client program) publishing data for the topic temp/random to a broker at test.mosquitto.org and 2 subscibers for that data (the gauge and the mosquitto_sub client program).

Your own Broker

Let’s set up our own broker and include python Mosquitto bindings so we can write some scripts:

sudo apt-get install mosquitto python-mosquitto

Now we can again use mosquitto_sub and mosquitto_pub publishing our familiar topic on our own server and subscribing to changes, use separate shell sessions to subscribe a client and use another client to publish:
mosquitto_sub -h localhost -t temp/random
mosquitto_pub -h localhost -t temp/random -m 21.0

You probably want to set up logging for the mosquitto daemon (which is probably disabled by default), In  /etc/mosquitto/mosquitto.conf adjust the log_dest and log_type entry like:
log_dest syslog
log_type error
log_type warning

Or any other valid entries like documented in the configuration file itself. If you want to see on which ports and addresses the daemon listens then you also need log_type information. This can be handy when troubleshooting certain issues.

Your own temperature Gauge

Only using the command line clients is quite boring off course, so you might want to host your own temperature gauge. Assuming you have a apache (or other webserver) already running on your own Linux host you can take the following steps:

  • Change your working directory to the Documentroot of your webserver, e.g:
    cd /var/www
  • Clone the github repository for the temperature gauge:
    git clone https://github.com/jpmens/tempgauge.git
  • Adjust the hostname parameter in the tempgauge/index.html file from “localhost” to the hostname or IP address of your MQTT Mosquitto server host. e.g change
    var client = new Messaging.Client("localhost", 18883, to
    var client = new Messaging.Client("10.1.1.123", 18883,

As the temperature gauge uses Websockets for communication with the MQTT server, websockets should be enabled in the MQTT server. For Mosquitto you need to add the following lines to the  /etc/mosquitto/mosquitto.conf file:

listener 18883
protocol websockets

It might be that your Linux distribution still includes an old version of Mosquitto that doesn’t yet include websockets, if that is the case have a look at Building Mosquitto 1.4 which explains in detail how to get websockets enabled in Mosquitto. (note that this method might conflict with the Mosquitto server that was installed by your package manager, please remove it first and beware of the location of your new mosquitto server). You now might have to start Mosquitto by hand instead of via the init.d or service scripts.

Now load the temperature gauge in your browser (e.g. use http://10.1.1.123/tempgauge) and publish a new value to the MQTT server:  mosquitto_pub -h 10.1.1.123 -t temp/random -m 18. If all went well you will see the gauge responding to your published values for the /temp/random subject on your Mosquitto server.

Related Stuff

Off course there is much more to using MQTT than what can be touched on in a small blog article. I will try to devote another article to related subjects like:

  • Security
  • QoS
  • Topic naming conventions
    • e.g. Physical versus Semantical naming schemes

References

Terminology

Note that the terminology used in this article is not always according to MQTT terminology: e.g. the terms ‘data’ or  ‘value’ should probably be replaced by ‘publication’.